Home › GCSE/IGCSE Notes › Physics › Movement & Position
Important Units
Kilogram (kg) - metric way of measuring weight; standard bag of sugar is 1kg
Metre (m) - metric measure for distance; approx. one stride
Metre per second (m/s) - measure of speed; how many meters you go in a second
Metre per second² (m/s²) - measure of velocity; how many meters you go in a second in a given direction
Newton (N) - measure of force
Second (s) - A sixtieth of a minute of time, or how long it takes to say Mississippi (not a scientific definition!)
Newton per kilogram (N/kg) - force for every kilogram of weight
Plotting and interpretting distance-time graphs
A distance time graph is a graph that shows the relationship between distance travelled and the time taken.
PLOTTING the distance time graph:
The Y axis should be the distance travelled from the start, meaning the bottom is time.
To plot simply mark the distance travelled at every chosen point of time: e.g every second.
The gradient of a distance-time graph is speed = distance / time , i.e S = D / T
PLOTTING the distance time graph:
The Y axis should be the distance travelled from the start, meaning the bottom is time.
To plot simply mark the distance travelled at every chosen point of time: e.g every second.
The gradient of a distance-time graph is speed = distance / time , i.e S = D / T
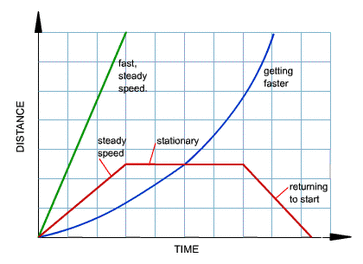
Note that the steeper the line, the greater the speed of the object.If the graph is curved, then the speed must be changing.
If it is curving upwards (blue line), the speed is increasing, if it is curving or sloping downwards, the speed is decreasing. So the gradient of the graph also tells us how the speed is changing. The steeper the line, the faster the object: it's doing more distance for time- more up for across.
If it is curving upwards (blue line), the speed is increasing, if it is curving or sloping downwards, the speed is decreasing. So the gradient of the graph also tells us how the speed is changing. The steeper the line, the faster the object: it's doing more distance for time- more up for across.
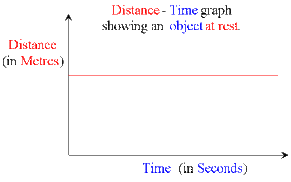
Here, distance isn't increasing as the gradient=0, thus, speed=0 , object is stationary (not moving). A straight line is a stationary object: because time is still going forward but the object is not moving up or down the distance axis.
This video will help. To get a speed see how much up it goes for across. (the graph in the video below goes two up for one across, that's two meters per second (2m/s).
Speed, distance and time
It is important to know and use the relationship between average speed, distance moved and the time taken: Average Speed = Distance Moved / Time taken
Acceleration = change in velocity / time taken (a= v-u/t)
Where v=final velocity
u=initial velocity and
t=time
Acceleration = change in velocity / time taken (a= v-u/t)
Where v=final velocity
u=initial velocity and
t=time
Plot the time taken for a toy car to travel and plot a distance time graph. Then repeat at different speeds and compare the different graphs.
Or, use a ticker tape; this makes a mark every second on the tape. If you attach the car to the end of the tape, its speed will be recorded: distance/dots = speed. For example, if you has 50 dots on a meter tape then it traveled at an average speed of (1/50) 0.02 meters per second.
EXAMPLE:
- Put a ruler on a table
- Give the toy car a push so that it will travel next to the ruler
- every five seconds record the distance that the car is on the ruler (starting with it at 0 seconds, the car was at 0cm)
- Draw a graph with time along the bottom and distance up the side
- At each five seconds interval plot the distance the car was at
1.6 plot and interpret velocity-time graphs
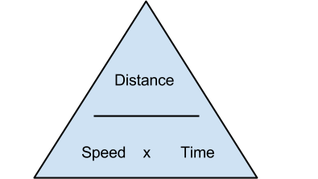
Average speed = distance moved / time taken (V = D/T), as shown in the diagram I have produced above.
1.7 determine acceleration from the gradient of a velocity-time graph
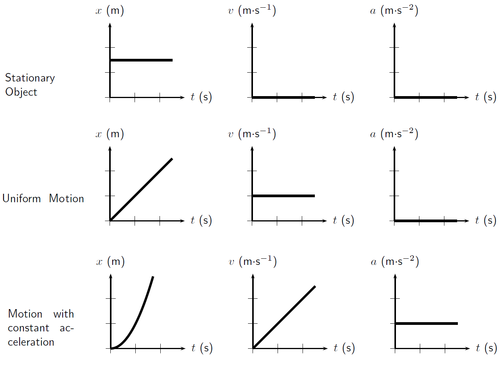
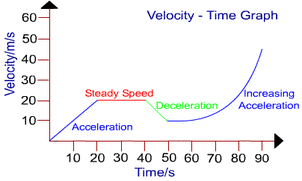
On the Y axis of a distance time graph is velocity- speed travelled in a give direction. On the X axis is time taken from start. Note that negative velocities mean something is travelling in the opposite direction to that of the positive velocity.
A line going diagonally upwards shows an acceleration, if it is straight it is a constant acceleration. This is because acceleration is change in velocity over time.
A line going diagonally down wards shows a deceleration. A straight downwards line shows constant deceleration. Again deceleration is change velocity over time but the velocity is decreasing.
The steeper the line the more rapid the acceleration because the velocity us changing over less time.
A straight line is a constant velocity: you are travelling at one speed in one direction.
1.5 know and use the relationship between acceleration, velocity and time:
EXAMPLE Q: “8 Miles is travelled in 40 minutes, what is the speed in m/s?” - Convert the miles to metres, and minutes to seconds.
1.4 describe experiments to investigate the motion of everyday objects such as toy cars or tennis balls
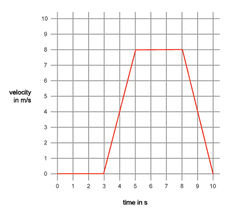
The gradient of a line on a velocity-time graph represents the acceleration of the object.
Acceleration is measured in meters per second per second: m/s/s or m/s².
This means we need to find out how many m/s are travelled every second.
Which is the same as "change in velocity / time".
We can work this out by looking at a time period in the graph and seeing how much the velocity changes. For example on this graph between second 3 and second 4 the velocity changes from 0 to 4: meaning that it changes 4 m/s every 1s
4/1= 4m/s²
So effectively you do 'up' divided by 'across' to give acceleration.
1.8 determine the distance travelled from the area between a velocity-time graph and the time axis
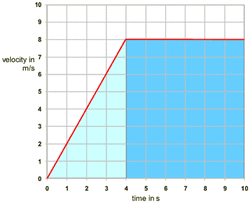
The area under a velocity time graph = distance travelled.
The distance can be calculated by finding the area between the velocity time graph (line) and the time axis. If you look there is a shape formed between the two lines, find the area of this using the measure given on the sides
e.g. The width of the triangle is 4 seconds and the height is 8 metres per second. to find the area of a triangle is 1/2 x base x height so 1/2 x 8 x 4= 16
The width of the rectangle is 6 seconds and the height is 8 metres per second. So the area is 8 × 6 = 48 m. Making the overall area 16 + 48 = 64 m.
Where next? Trending pages on OxNotes 🔥
- StudentSpace
- Back to IGCSE Physics menu (all Physics notes)
- Magnetism Notes
- Other GCSE subjects OxNotes covers
- Revision Tips & Techniques Blog
- Search all notes by keyword (e.g. Movement, Density, Magnetism):

